This is in some ways a continuation of the prior blog entry on how to create spreadsheet output.
EZ13 provides several types of reports. Let's look at what each provides. (I'll describe specifically the spreadsheet output type #1; the text report includes basically the same information, but laid out differently.)
1) Income Statement/Balance Sheet Detail: This is our most comprehensive report of calculated information (all of the accounts involved in lease accounting for a period). We've tried to break out every account so you can see exactly what's happening. Each balance sheet account, for instance, shows five different values: beginning balance, added (for new leases), activity, removed (for terminations), and ending balance. In all, this report shows some 74 columns of calculated data, plus as many as 43 columns of descriptive information (including account numbers if you define them).
And that's just the first tab. On the second tab, we show the future minimum rent information. If you get minimum rents broken out by year for the first 5 years, then all remaining as a lump sum (as FAS 13 requires), the second tab shows 42 columns of calculated data per lease.
2) Income Statement/Balance Sheet Compact: Maybe that's overkill for you. The compact report shows 16 columns of calculated data, giving the essential highlights (just the ending balance for each balance sheet account, for instance).
3) Journal Entries: You may prefer to see each transaction a lease generates in journal entry form (each rent payment is a debit to obligation, a debit to accrued interest, and a credit to cash; etc.). Each line shows the lease number, period start and end date, account name, account number (if defined), debit or credit, and a description of the transaction so you know which lines go together and what they're for.
4) Amortization Schedule - Capital & Operating: You can view the activity for the entire life of a lease, with a separate line entry for each rent payment. Note that this report can get very large if you have many long leases; if you have several hundred leases that run 20 years or more paid monthly, you could exceed the maximum number of rows (65536) in versions of Excel before Office 2007. If that happens, you'll need to select subgroups of leases to report on (or upgrade Excel; the 2007 version permits over 1 million rows).
5) Future Minimum Rents: This report is identical to the second tab of the Income Statement/Balance Sheet Detail report. It's provided in case you only need future rent information.
6) Depreciation Over Economic Life: If you have leases that have an ownership transfer or bargain purchase option, they are depreciated over their economic life, which in most cases is longer than the lease term. Regular EZ13 reports stop reporting on a lease when it expires. This report shows the depreciation after the lease's expiration, until the end of its economic life.
7) Classification Summary: Lists how each lease fits into the four tests for capitalization; if the lease is capital, its capital rate is shown.
8) Listing: As mentioned above, this report is not available in spreadsheet format except as an export of a text report. The reason is that there is really no way to show all the input information for a lease across a single row: There can be an indeterminate number of rent steps, for instance, which can easily overwhelm the maximum number of columns in Excel.
I hope this helps you get the results most useful to you. Most accountants and financial people live in Excel, and it's also a common method of importing and exporting data (such as loading results of EZ13 into a general ledger system). Knowing the best way to get the spreadsheet information you want can make EZ13 much more useful.
Tuesday, May 5, 2009
Monday, May 4, 2009
EZ13 spreadsheet output
With the review of the leases discussion paper complete (see previous blog entries for a chapter by chapter review), I thought I'd take some time to review some aspects of EZ13, our lease accounting software that provides complete compliance with FAS 13 for lessee leases (and FAS 13 compliance for most lessor leases as well, in the separate lessor edition).
Based on questions we've gotten from customers, it seems there's some confusion about the ways to get output, particularly spreadsheet output. EZ13 offers two different ways to get spreadsheet output, each having a different purpose.
1) Most people wanting spreadsheet output will want a format where each lease is on a single line, with the accounts and values for that lease each in a separate column. For this type of output, you should choose output to "Spreadsheet" in the report setup page:
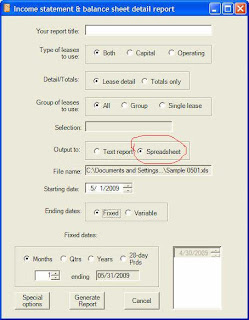
As soon as you click on the Spreadsheet button, EZ13 will open a dialog box for the name of the spreadsheet. Most people will create an Excel spreadsheet (.xls format). However, this requires that you have a valid installation of Excel on your computer. If you do not, you can create spreadsheet output in XML format, which can be read by Excel, OpenOffice Calc, and various other spreadsheet applications. To select XML output, go to the File menu, choose System Options, and check the box labeled "XML spreadsheet output." (XML output is also a bit faster to create, and less subject to memory limitations with very large reports.)
Once you click on Generate Report, EZ13 will build the spreadsheet. The output for an Income Statement/Balance Sheet Detail report looks something like this:
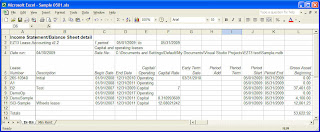 Each row shows a different lease. There is a column for the lease number, description, begin date, end date, gross asset beginning value, and so on. The last row is a totals line, which is the summation of all the columns that have value information (as opposed to descriptive information).
2) The other way to get spreadsheet output is using the Export feature of the text output. Text output is designed to be easily readable, putting all the information for a lease together on several lines so that you don't have to constantly scroll back and forth across the line. However, that makes it much less practical to manipulate (sort, select, sum, etc.) in Excel. One advantage of this method of getting spreadsheet output, however, is that the report writer can create an Excel spreadsheet without you having Excel installed on your computer. Also, this is the only way to get a spreadsheet of the listing report, which lists all the input data for a lease.
If you create a text output version of this same report, then export it to Excel, it will look something like this:
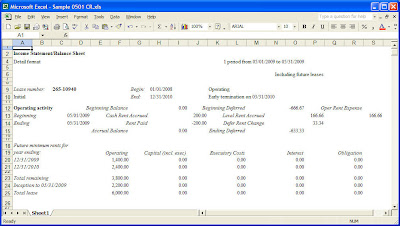
This is basically a repeat of what you see on the screen for a text report. Note that sometimes the columns won't line up correctly; the report writer is trying its best to guess what should be aligned, but it doesn't always make the right decisions, and unfortunately there's no way for us to tweak the results. In most cases, an export to PDF, HTML, or a Word .doc document is going to give better looking results. But if you really prefer to get information in Excel format, it's here.
Subscribe to:
Posts (Atom)
